Se ofrecen aquí unos ejemplos de ejercicios resueltos similares a los ejercicios SVG Brython (2).
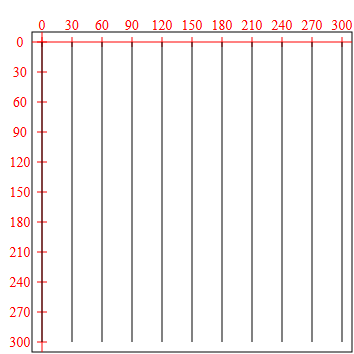
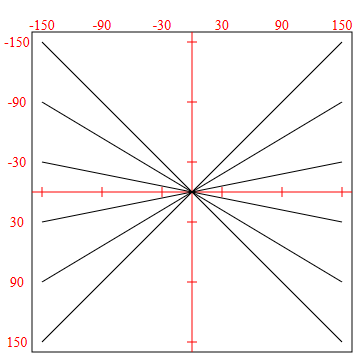
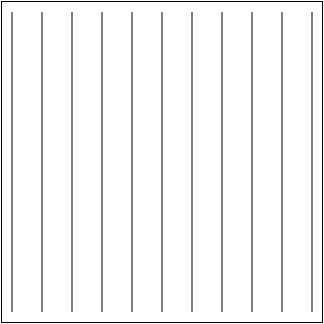
Queremos completar la página web que se muestra a continuación a la izquierda de manera que se muestre el dibujo que se muestra a la derecha:
<!DOCTYPE html>
<html lang="es">
<head>
<meta charset="utf-8">
<title>SVG Brython (2) 0 1. Ejercicios. Python</title>
<meta name="viewport" content="width=device-width, initial-scale=1.0">
<script src="https://cdn.jsdelivr.net/npm/brython@3.9.0/brython.min.js"></script>
<script src="https://cdn.jsdelivr.net/npm/brython@3.9.0/brython_stdlib.js"></script>
<script type="text/python3">
# Aquí se escribiría el programa de Python
</script>
</head>
<body onload="brython()">
<svg version="1.1" xmlns="http://www.w3.org/2000/svg"
width="320" height="320" viewBox="-10 -10 320 320"
style="border: black 1px solid" id="imagen">
</svg>
</body>
</html>
for i in range(11):
# instrucción que dibuja una línea
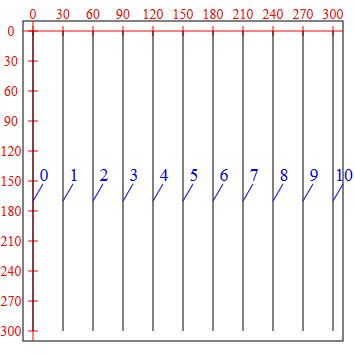
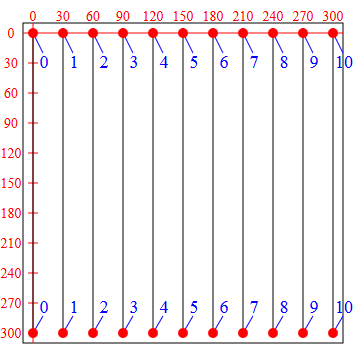
Las líneas se han numerado de 0 a 10 en vez de 1 a 11 porque la variable i del bucle for toma valores de 0 a 10.
i: 0 1 2 3 4 5 6 7 8 9 10 Fórmula X: 0 30 60 90 120 150 180 210 240 270 300 --> 30*i Y: 0 0 0 0 0 0 0 0 0 0 0 --> 0
i: 0 1 2 3 4 5 6 7 8 9 10 Fórmula X: 0 30 60 90 120 150 180 210 240 270 300 --> 30*i Y: 300 300 300 300 300 300 300 300 300 300 300 --> 300
from browser import document
import browser.svg as svg
for i in range(11):
document["imagen"] <= svg.line(x1=30*i, y1=0, x2=30*i, y2=300, stroke="black", stroke_width=1)
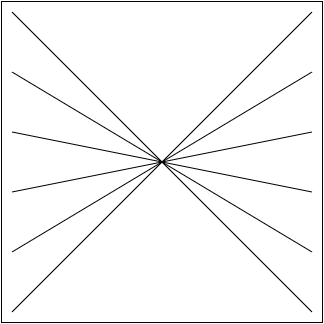
Queremos completar la página web que se muestra a continuación a la izquierda de manera que se muestre el dibujo que se muestra a la derecha:
<!DOCTYPE html>
<html lang="es">
<head>
<meta charset="utf-8">
<title>SVG (3) 0 2. Ejercicios SVG (3). Brython. Python</title>
<meta name="viewport" content="width=device-width, initial-scale=1.0">
<script src="https://cdn.jsdelivr.net/npm/brython@3.9.0/brython.min.js"></script>
<script src="https://cdn.jsdelivr.net/npm/brython@3.9.0/brython_stdlib.js"></script>
<script type="text/python3">
# Aquí se escribiría el programa de Python
</script>
</head>
<body onload="brython()">
<svg version="1.1" xmlns="http://www.w3.org/2000/svg"
width="320" height="320" viewBox="-160 -160 320 320"
style="border: black 1px solid" id="imagen">
</svg>
</body>
</html>
for i in range(6):
# instrucción que dibuja una línea
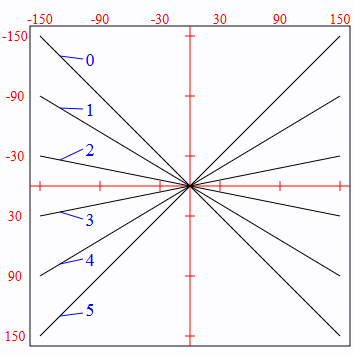
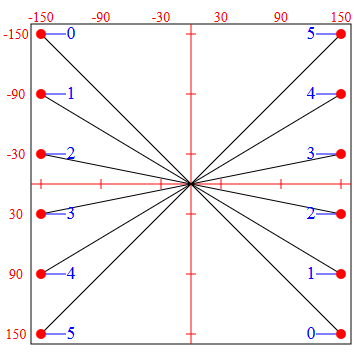
Las líneas se han numerado de 0 a 5 en vez de 1 a 6 porque la variable i del bucle for toma valores de 0 a 5.
i: 0 1 2 3 4 5 Fórmula X: -150 -150 -150 -150 -150 -150 --> -150 Y: -150 -90 -30 30 90 150 --> -150+60*i
i: 0 1 2 3 4 5 Fórmula X: 150 150 150 150 150 150 --> 150 Y: 150 90 30 -30 -90 -150 --> 150-60*i
from browser import document
import browser.svg as svg
for i in range(11):
document["imagen"] <= svg.line(x1=-150, y1=-150+60*i, x2=150, y2=150-60*i, stroke="black", stroke_width=1)
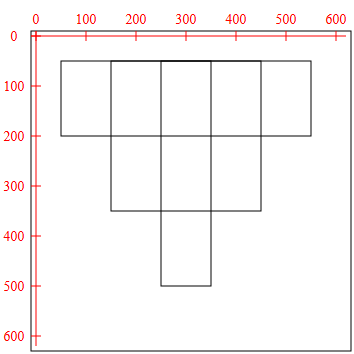
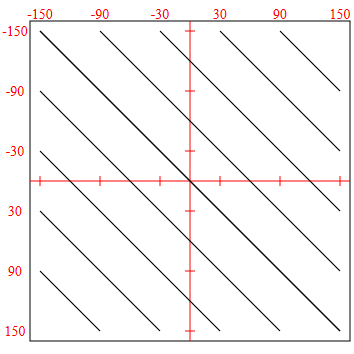
Queremos completar la página web que se muestra a continuación a la izquierda de manera que se muestre el dibujo que se muestra a la derecha:
<!DOCTYPE html>
<html lang="es">
<head>
<meta charset="utf-8">
<title>SVG (3) 0 3. Ejercicios SVG (3). Brython. Python</title>
<meta name="viewport" content="width=device-width, initial-scale=1.0">
<script src="https://cdn.jsdelivr.net/npm/brython@3.9.0/brython.min.js"></script>
<script src="https://cdn.jsdelivr.net/npm/brython@3.9.0/brython_stdlib.js"></script>
<script type="text/python3">
# Aquí se escribiría el programa de Python
</script>
</head>
<body onload="brython()">
<svg version="1.1" xmlns="http://www.w3.org/2000/svg"
width="320" height="320" viewBox="-20 -20 640 640"
style="border: black 1px solid" id="imagen">
</svg>
</body>
</html>
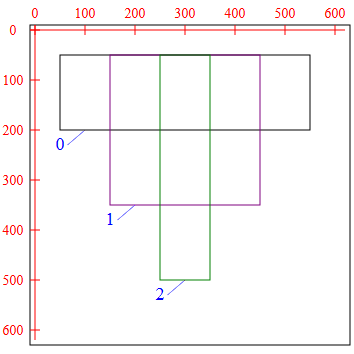
for i in range(3):
# instrucción que dibuja un rectángulo
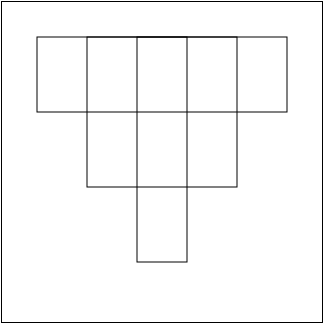
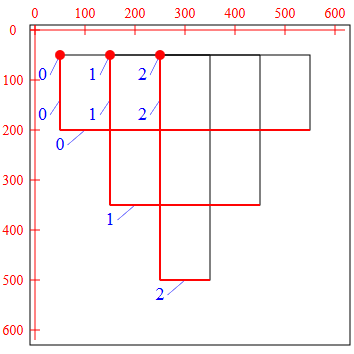
Los rectángulos se han numerado de 0 a 2 en vez de 1 a 3 porque la variable i del bucle for toma valores de 0 a 2.
i: 0 1 2 Fórmula X: 50 150 250 --> 50 + 100*i Y: 50 50 50 --> 50 Ancho: 500 300 100 --> 500 - 200*i Alto: 150 300 450 --> 150 + 150*i
from browser import document
import browser.svg as svg
for i in range(3):
document["imagen"] <= svg.rect(x=50+100*i, y=50, width=500-200*i, height=150+150*i, stroke="black", stroke_width=2, fill="none")
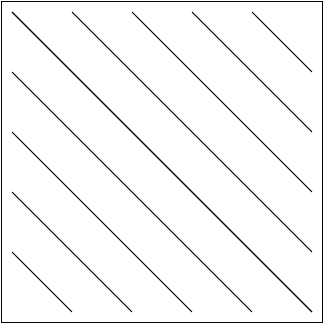
Queremos completar la página web que se muestra a continuación a la izquierda de manera que se muestre el dibujo que se muestra a la derecha:
<!DOCTYPE html>
<html lang="es">
<head>
<meta charset="utf-8">
<title>SVG (3) 0 4. Ejercicios SVG (3). Brython. Python</title>
<meta name="viewport" content="width=device-width, initial-scale=1.0">
<script src="https://cdn.jsdelivr.net/npm/brython@3.9.0/brython.min.js"></script>
<script src="https://cdn.jsdelivr.net/npm/brython@3.9.0/brython_stdlib.js"></script>
<script type="text/python3">
# Aquí se escribiría el programa de Python
</script>
</head>
<body onload="brython()">
<svg version="1.1" xmlns="http://www.w3.org/2000/svg"
width="320" height="320" viewBox="-160 -160 320 320"
style="border: black 1px solid" id="imagen">
</svg>
</body>
</html>
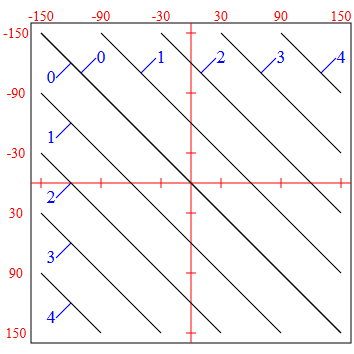
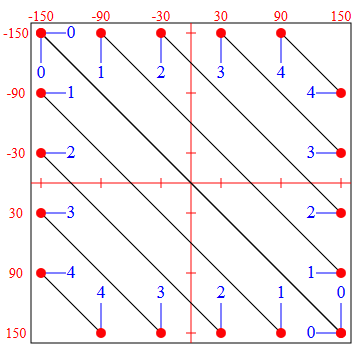
for i in range(5):
# instrucción que dibuja una línea
# instrucción que dibuja otra línea
Las líneas se han numerado de 0 a 5 en vez de 1 a 6 porque la variable i del bucle for toma valores de 0 a 5.
i: 0 1 2 3 4 Fórmula X: -150 -150 -150 -150 -150 --> -150 Y: -150 -90 -30 30 90 --> -150+60*i
i: 0 1 2 3 4 Fórmula X: 150 90 30 -30 -60 --> 150-60*i Y: 150 150 150 150 150 --> 150
i: 0 1 2 3 4 Fórmula X: -150 -90 -30 30 90 --> -150+60*i Y: -150 -150 -150 -150 -150 --> -150
i: 0 1 2 3 4 Fórmula X: 150 150 150 150 150 --> 150 Y: 150 90 30 -30 -60 --> 150-60*i
from browser import document
import browser.svg as svg
for i in range(5):
document["imagen"] <= svg.line(x1=-150, y1=-150+60*i, x2=150-60*i, y2=150, stroke="black", stroke_width=1)
document["imagen"] <= svg.line(x1=-150+60*i, y1=-150, x2=150, y2=150-60*i, stroke="black", stroke_width=1)